As per Punjab Pollution Control Board (PPCB) data, the Air quality Index or AQI of Punjab had worsened to very poor level on Diwali night. In the corresponding same period in the years 2019 and 2018, the recorded AQI was in ‘poor’ category.
Late Sunday, six of Punjab’s major cities recorded ‘very poor’ category of AQI, with Amritsar topping the chart followed by Ludhiana and Patiala. Much fewer stubble burning cases were found around Diwali by satellite data, but the scenario of the current year is grim on an overall basis.
The real-time data provided this year by the PPCB from the Continuous Ambient Air Quality Monitoring Stations situated at Amritsar, Ludhiana, Khanna, Mandi Gobindgarh, Patiala, Bathinda and Ropar, showed that the average AQI of Punjab was 328 (very poor) against 293 (poor) last year. It was 234 (poor) in 2018 and 328 (very poor) in 2017.
As per the recorded data, last year, the minimum level of PM10 (particulate matter) was at 90 microgram per cubic meter, and PM2.5 was at 43 microgram per cubic meter. This year, these were at 118 and 90 micrograms per cubic meter respectively. Both PM10 and PM2.5 were under the ‘moderately polluted’ category as per quality zone categorization.
Interestingly, there has been a substantial recovery in the air quality of Chandigarh, whose AQI, was at 145 on Sunday morning as compared to 267 on Diwali night last year. PPCB sources stated that after celebrating a Green Diwali to a limited extent for two years, Punjab again returned to bursting crackers in the business as usual mode this year.
This year on Diwali, 352 stubble burning cases were recorded against 2,231 similar incidents recorded last year. On Sunday, only 96 stubble burning cases were recorded. This year, till November 7, there were a record high number of stubble burning incidents in Punjab. The number of stubble burning cases had crossed 58000, which is a three-year high figure.
What is AQI
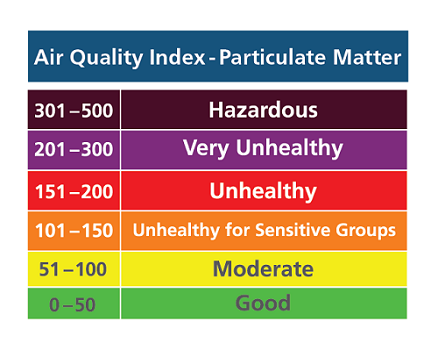
AQI can be considered as a yardstick measuring the air quality that runs from 0 to 500. Since it is an index, it has no units. Accepted norm is that the higher the AQI value, the greater the level of air pollution and the greater the health concern. For example, an AQI value of 50 or below represents good air quality, while an AQI value over 300 represents a hazardous air quality.
For each pollutant an AQI value of 100 generally corresponds to an ambient air concentration that equals the level of the short-term national ambient air quality standard for protection of public health. AQI values at or below 100 are generally thought of as satisfactory. When AQI values are above 100, air quality is unhealthy, at first for certain sensitive groups of people, then for everyone as AQI values get higher.
The AQI is divided into six categories. Each category corresponds to a different level of health concern. Each category also has a specific colour. The colour makes it easy for people to quickly determine whether air quality is reaching unhealthy levels in their communities. The colours generally included are Green, Yellow, Orange, Red, Purple, and Maroon. There are eight pollutants whose concentrations are used as metric for this index, namely particulate matter (PM) 10, PM2. 5, Ozone (O3), Sulphur dioxide (SO2), nitrogen dioxide (NO2), carbon monoxide (CO), lead (Pb) and ammonia (NH3). Their aerial concentrations act as major parameters in deriving the AQI of an area.
The author is a member of Amity center of Happiness